
Product analytics
See who runs your product: how many installs are active, and on which operating system, architecture, runtime, platform, product version and country, over time. Like bStats for Minecraft plugins, for every kind of product, and for free builds too.
Product analytics is on every plan. Free keeps 30 days of history, Lite 90 days and Standard a year (see plans). It never slows down or refuses a license check.
Where to find it
- Products → a product → Analytics: active installs over time and a breakdown of every metric.
- Analytics → Installs: active installs of each product, with a link to its Analytics tab.
- A license's Activations and a customer's Machines: under each machine, what it last reported (product version, platform, runtime, operating system); open the line for every field and the time of the last report. Only installs that report with a license key and the machine's fingerprint appear here; free builds' reports never do.
- The customer portal: your customers see the same line under each of their own machines, which helps them pick the right one before a reset.
Members need the analytics.read permission to see the tab, and products.write to change its settings (team and roles).
Start reporting
Licensed products: start the SDK's analytics with the API key, license key and machine id the product already validates with. Every official SDK does it from 0.1.0, and the templates do it for you. It reports in the background every 30 minutes and never touches the license check.
Free or unlicensed builds: report with the product's product analytics id (pa_…). Open the product's Analytics tab: before the first report it shows the id with a copy button and a snippet. The id is public by design (it ships inside your build); it can only add installs to that product's charts, never read anything.
// Licensed
SunLicenseAnalytics analytics = SunLicenseAnalytics.builder()
        .apiKey(apiKey).licenseKey(licenseKey).fingerprint(machineId)
        .productVersion("2.3.1")
        .start();

// Free, without a license key
SunLicenseAnalytics analytics = SunLicense.analytics("pa_7Hk2mQ9xZr4LbN8vT1wYcD");
The same in JavaScript, Python, .NET, PHP and Lua, every field the SDKs send, feature usage and custom charts are in SDKs → Built-in analytics. Anything else can send the report over HTTP (POST https://api.sunlicense.com/api/v2/analytics/report).
Charts appear a few minutes after the first report. Installs that report with a license key are licensed (linked to the license, its customer and the machine); installs that report with the product analytics id are unlicensed and unverified. Use the filter at the top of the tab to see either or both.
Reading the tab
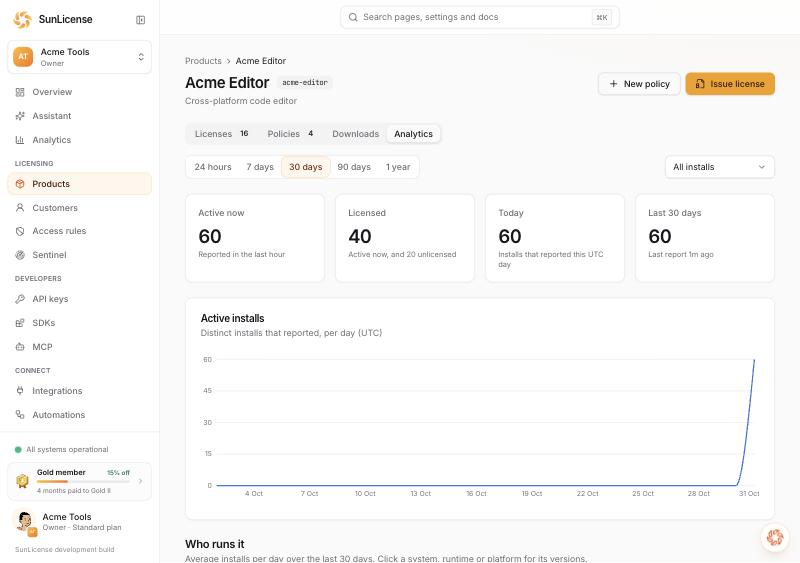
- Range: 24 hours (by the hour), 7, 30, 90 days or a year (by UTC day). Ranges longer than your plan keeps are locked, with the plan that keeps them.
- Active now: installs that reported in the last hour. Today: installs that reported this UTC day. Last 30 days: distinct installs seen in 30 days.
- Active installs: distinct installs per hour or day. The current period is included and counts up during its first 30 minutes.
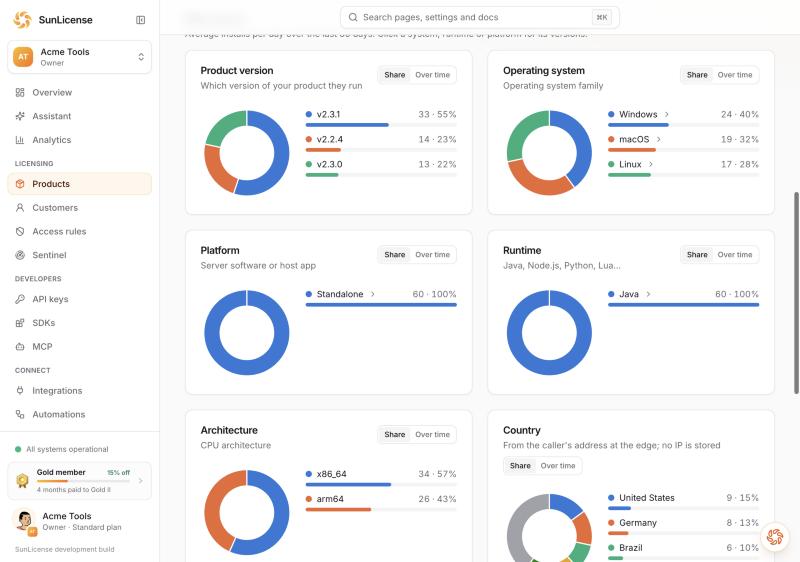
- Who runs it: one card per metric. Share shows the top values as a donut and a list, Over time their installs per period. On the 24-hour range the shares are the last complete hour; on longer ranges they're the average per day. Click an operating system, runtime or platform for its versions.
| Metric | Shows |
|---|---|
| Product version | Your product's version, as the install reports it (v2.3.1 (build 7) counts as 2.3.1) |
| Operating system | Windows, macOS, Linux, FreeBSD, Android; click for versions (Linux 5.15, Windows 11) |
| Platform | Server software or host app (Paper, Velocity, Fabric, FiveM, Standalone…); click for versions |
| Runtime | Java, Node.js, Python, Lua…; click for major versions (Java 21) |
| Architecture | x86_64, arm64, x86, arm |
| Country | From the address the report came from, at the edge. No IP address is stored |
| Licensed vs unlicensed, CPU cores, Locale, SDK | Under More breakdowns |
Each metric keeps its 100 most common values; rarer ones are counted as Other.
Feature usage and custom charts
On Lite and Standard plans the tab also shows what your own code measures.
Feature usage. Count a feature each time it runs; the tab lists every feature with the installs that used it (per day, on average over the range, with their share of all installs) and its total uses.
analytics.feature("auto-sell");        // one use
analytics.feature("web-editor", 3);    // three uses
Custom charts. Register a chart in your product's code and it appears on the tab after the next report, with bStats' chart types:
| Method | Shows | Example |
|---|---|---|
simplePie(id, () -> "mysql") | One value per install, as a donut | Storage backend |
advancedPie(id, () -> Map.of("vault", 1, "placeholderapi", 1)) | Several weighted values per install | Hooked plugins |
drilldownPie(id, () -> Map.of("Java 21", Map.of("21.0.4", 1))) | A donut with a second level: click a slice | Versions by major |
singleLine(id, () -> players) | One number per install, summed over installs, over time | Players online |
multiLine(id, () -> Map.of("overworld", 30, "nether", 12)) | Several summed numbers over time | Loaded chunks per world |
simpleBar(id, () -> Map.of("sell", 12, "buy", 3)) | Numbers per key, as bars | Shop actions |
advancedBar(id, () -> Map.of("diamond", new int[] {120, 95})) | Up to 20 numbers per key | Prices |
Chart ids and feature names are lower-case letters, digits, ., _ and - (up to 48). A callback that returns nothing (null or empty) leaves its chart out of that report; callbacks run on the analytics thread, never on yours. Each chart keeps its 200 most common values; rarer ones count as Other.
Chart settings (members who can edit products): rename a chart, hide it, change the order or delete a chart you removed from your code. Your plan collects a number of custom charts per product (Lite 5, Standard unlimited): the first ones in the chart settings' order that aren't hidden. A chart past the limit is listed with what it missed; hide another one, or upgrade, to collect it. Hidden charts aren't collected and don't count.
On Free the tab shows the charts your product reports and what upgrading would collect; nothing is stored.
Settings
At the bottom of the tab:
- Turn off: new reports from this product's installs are refused (the SDKs try again a day later). What was collected stays. Analytics is on for every product until you turn it off.
- New id: replaces the product analytics id. The old one stops working at once, so free builds that ship it stop reporting until you release them with the new one. Licensed installs aren't affected.
Custom pages
On Standard, Analytics → Pages holds pages of your own: pick charts from any of your products (built-in breakdowns, feature usage, your custom charts), show each as a line over time, a pie or bars, half or full width, and put them in the order you want. Everyone in your organization who can see analytics sees the pages; changing them needs permission to edit products. Pages saved on Standard stay readable if you change plan; editing them needs Standard again.
Public stats page
On Standard, a product's Analytics tab has a Public stats page card. Switch it on, choose the address and the charts, and link the page from your store page:
portal.sunlicense.com/<your organization>/stats/<address>, orhttps://<your portal domain>/stats/<address>when your portal has its own domain.
The page shows your brand and only the charts you picked. It's off until you switch it on, and it works whether or not the customer portal is on. Visitors see aggregates only: no customer names, emails, license keys, machines, cities or IP addresses. Numbers are rounded (to 5 under 100, to 10 under 1,000, then to two significant figures), and any group of fewer than 5 installs is hidden (merged into Other, or left out), so nobody can single out one customer. Lines cover the window you choose (7 days to a year, within your plan's history); pies and bars show the last complete hour. The page refreshes every 5 minutes. If your plan stops including public stats pages, the page stops being shown and comes back when you upgrade.
From the CLI, your AI assistant and SunLicense AI
sunlicense analytics <product> --metric os --days 30prints the same numbers as a table, and the full-screen app has an Analytics tab (commands).sunlicense initprints the product analytics id and a snippet.- The MCP tools
analytics_summary,analytics_breakdownandanalytics_featuresgive your coding assistant the same data (AI assistants (MCP)). - Ask SunLicense AI "which Java versions do my servers run?" or "is anyone still on 1.2?": it answers from the same numbers and links the chart.
All three read through the same API as the tab, so your role, your token's scopes and your plan's history apply.
Sentinel and automations
Sentinel uses what licensed installs report to spot a license running on many different devices at once, or a build of one product unlocked with another product's license. Automations can start when a new version is first reported, a license uses a feature for the first time, or active installs cross a number you pick.
Limits
Your plan counts tracked installs: installs seen in the last 30 days (Free 1,000, Lite 10,000, Standard unlimited; see Usage). Past the limit, installs you already track keep reporting and new ones aren't stored. Nothing is ever refused because of it, and license checks don't count toward it.
What end users can switch off
An install sends nothing when its user sets the product's analytics: false config option (or the platform's equivalent), the environment variable SUNLICENSE_ANALYTICS=off, or the system property sunlicense.analytics=false. Reports never contain user names, host names, IP addresses, file paths or player names. Tell your users in your product's documentation that it reports anonymous usage statistics and how to switch it off.